
The Football Language Model: 2,000+ Metrics That Describe the Modern Game
Modern football is described by 2,000+ tracked metrics — from xG to PPDA to OBV. We explain the structure of football's metric vocabulary, how it grew, and how to navigate it.
 Tap to enlarge
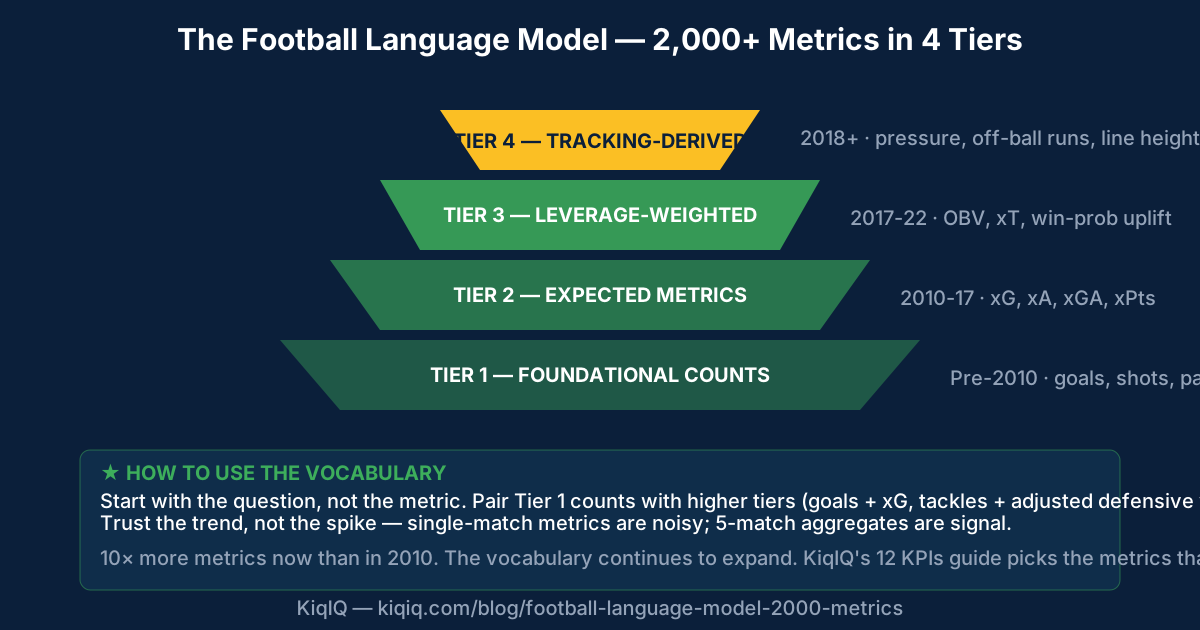
Modern football is described by 2,000+ tracked metrics across the major data providers (Opta, StatsBomb, Wyscout, etc.). The vocabulary has grown rapidly since 2010 and shows no sign of slowing. The metrics organise into four tiers: foundational counts (goals, shots, passes), expected metrics (xG, xA, xGA), leverage-weighted metrics (OBV, expected threat, win-probability uplift), and tracking-derived metrics (pressure, off-ball runs, defensive line height). Navigating the vocabulary is a skill in itself.
Tier 1 — Foundational counts (Pre-2010)
The original football statistics. Counted from 1888 onwards in match reports, formalised by Opta in 1996:
- Goals, assists, shots, shots on target.
- Passes attempted + completed, pass accuracy.
- Tackles, interceptions, clearances, blocks.
- Corners, free kicks, penalties.
- Yellow cards, red cards, fouls committed/won.
- Possession % (in three different methods).
Tier 1 counts dominated football statistics for ~120 years. They're easy to compute but lack context — a 12-shot match could be brilliant or wasteful.
Tier 2 — Expected metrics (2010-2017)
Probability-based metrics built on Tier 1 counts. The breakthrough was xG:
- xG (expected goals). Weight every shot by the probability of scoring given location, body part, etc.
- xGOT (post-shot xG). Conditional on the shot being on target — measures finishing skill.
- xA (expected assists). Weight every chance-creating action by the xG of the chance produced.
- xGA (expected goals against). Defensive equivalent — quality of chances conceded.
- xPts (expected points). Probability of points won given xG vs xGA in each match.
Tier 3 — Leverage-weighted metrics (2017-2022)
Metrics that weight actions by their game-state importance:
- OBV (On-Ball Value). Every action rated by its contribution to scoring or conceding probability — leverage-weighted.
- xT (expected threat). Position-based threat scoring; pioneered by Karun Singh.
- Win-probability uplift. A goal in a 0-0 game is worth ~0.2 win-probability points; the same goal in a 4-0 game is worth ~0.005. Adjusts for game state.
- Adjusted defensive value. Tackles + interceptions + recoveries weighted by zone and game context.
- xT differential per 90. A combined attack + defence rating in xT terms.
Tier 4 — Tracking-derived metrics (2018-present)
Metrics that require positional data on every player at every moment, not just on-ball events:
- Pressure intensity. Per-second proximity-and-velocity-based pressure scores.
- Off-ball run quality. Quality of runs into space, regardless of whether the ball arrives.
- Defensive line height. Continuous tracking of where the back-line sits.
- Ball-recovery time. Average seconds from possession loss to win-back.
- Pass into pressure. Probability that a pass arrives at a pressed teammate.
Why so many metrics now?
Three drivers of the metric explosion:
- Better data infrastructure. Tracking systems and event-coding scale make it possible to compute metrics that were previously inconceivable.
- Recruitment-decision pressure. Multi-million-pound transfer decisions create demand for ever-more-specific metrics to differentiate similar players.
- Academic + industry research. Researchers publish new metrics; data providers commercialise them; clubs adopt the proven ones; the cycle repeats.
How to navigate the vocabulary
Three principles for using football metrics well:
- Start with the question, not the metric. "Is this striker a good finisher?" → xG vs goals. Don't start by browsing metrics looking for something to say.
- Pair Tier 1 with higher tiers. Goals + xG together is more informative than either alone. Tackles + interceptions + adjusted defensive value reveals what raw tackle counts hide.
- Trust the trend, not the spike. Single-match metrics are noisy. Five-match or season-aggregate metrics are signal.
Where the vocabulary is heading
Three predictions for the next 5 years:
- Causal-inference metrics. Moving from correlation ("teams with this metric tend to win") to causation ("doing X causes a Y change in win probability").
- Player-style fingerprints. Multi-metric vector representations of each player (similar to the player-profile widget approach), enabling similarity search at scale.
- Live in-match probabilistic updates. Real-time updating of metrics during matches, surfaced in broadcast graphics.
Frequently asked questions
- How many metrics describe modern football?
- 2,000+ across the major data providers (Opta, StatsBomb, Wyscout). The number has grown rapidly since 2010 and continues to grow. The metrics organise into four tiers: foundational counts (goals, shots, passes), expected metrics (xG, xA, xGA), leverage-weighted metrics (OBV, expected threat), and tracking-derived metrics (pressure, defensive line height).
- What is the most important football metric?
- Depends on the question. xG is the headline single metric for chance quality (attack and defence). PPDA is the headline pressing metric. OBV is the headline leverage-weighted metric. Defensive line height is the headline structural metric. There's no single "best" metric — modern analysis uses combinations to triangulate insight.
- Why are there so many metrics now?
- Three drivers: better data infrastructure (tracking systems, event-coding scale), recruitment-decision pressure (multi-million-pound transfers create demand for differentiation), and the academic + industry feedback loop (research → commercialisation → club adoption → new research). The vocabulary has grown 10× since 2010 and continues to expand.
- How do I know which metrics matter?
- Start with the question, not the metric. Pair foundational counts with higher-tier metrics (goals + xG, tackles + adjusted defensive value). Trust trend over spike — single-match metrics are noisy; 5-match or season aggregates are signal. KiqIQ's `/blog/key-performance-indicators-football` covers the 12 KPIs that consistently predict outcomes.
References
- Opta — Advanced Metrics — Opta
- StatsBomb — Methodology Articles — StatsBomb
- On-Ball Value (OBV) Methodology — StatsBomb
- Karun Singh — Expected Threat — Karun Singh
Key terms in this article
Ask KiqIQ a follow-up
Get a live, data-driven answer powered by api-football + KiqIQ's Poisson model. Try one of these prompts or write your own.
Try the calculators
Apply the concepts from this article with KiqIQ's free calculators.
Part of pillar
Data and Systems
See every article in this knowledge pillar →
Related
Reviewed by a KiqIQ editor before publication. Spotted an error? Email editor@kiqiq.com — we follow our Corrections Policy.