Your squad pressed 34 times last Saturday. Your PPDA was 6.2. Neither number tells you whether your press is generating turnovers or burning out your midfielders before the hour mark.
By David Findlay, Founder of KiqIQ.
Quick Answer: PPDA in football stands for Passes Per Defensive Action and measures how many passes the opposition completes before your team intervenes. Lower scores indicate higher pressing intensity. To act on it correctly, pair PPDA with press-break rate and cut everything else from your weekly tracking stack until those two metrics are reliable and trusted by the coaching staff.
Definition: PPDA football is a pressing intensity metric that calculates the average number of passes an opposition completes for every defensive action taken by the pressing team within a defined pitch zone. Defensive actions include tackles, interceptions, and fouls. Lower PPDA values indicate higher pressing intensity. It is the most widely adopted single-number proxy for pressing aggression in professional and semi-professional football analysis.
Key point: PPDA is only defensible as a primary pressing KPI when the zone boundary and defensive action criteria are defined consistently across every match and every analyst session. Inconsistent definitions are the primary source of PPDA data failure below professional level.
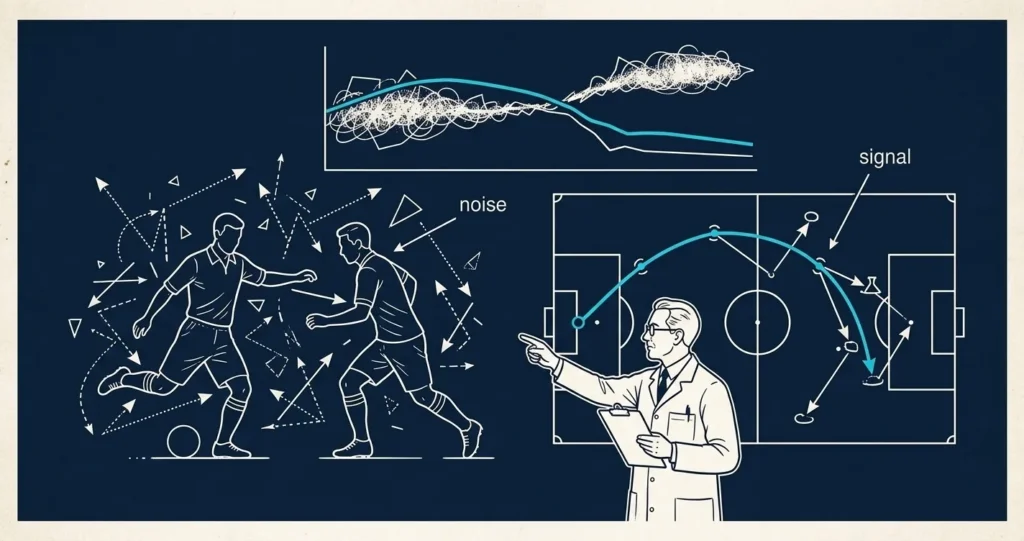
While the definition is standard, the instrumentation friction is where most departments fail to find signal.
What PPDA Measures in Football
PPDA is calculated by dividing the number of passes an opposition completes in a defined pitch zone by the number of defensive actions the pressing team takes in that same zone. The zone is typically the opponent’s half, though some analysts apply a more advanced trigger line running from the opposition defensive third to the midfield line depending on platform convention and tactical context.
The metric was developed to address a core problem with raw pressing counts. A team that makes 40 defensive actions against a side completing 240 passes is operating under very different conditions than a team making 40 defensive actions against a side completing 80 passes. Raw counts ignore possession share. PPDA normalises for it, which makes cross-match and cross-season comparisons meaningful.
PPDA became widely adopted after StatsBomb developed and promoted it as a pressing metric, and it is now available through platforms including Wyscout, FBref, and Opta. Its accessibility is part of its appeal. It can be tracked from broadcast footage and event data without GPS or advanced tracking hardware, which makes it viable at lower levels of the game.
What PPDA Does Not Measure
PPDA measures how frequently defensive actions occur relative to opposition passing volume. What it does not measure is whether those actions were produced by a coordinated pressing structure.
Two teams can produce identical PPDA scores while pressing in fundamentally different ways.
In one scenario, a centre-forward presses aggressively while the midfield line holds position behind him. In another, the entire defensive block steps forward together, closing space and eliminating passing options before the tackle or interception even occurs. Both sequences may end with a defensive action. In event data, they appear identical. From a tactical perspective, they are not.
PPDA records how often pressure results in an intervention. It does not record whether the defensive block moved collectively to make that intervention possible. For that reason, PPDA should be interpreted as a pressing activity indicator, not a full description of pressing quality.
How to Calculate PPDA in Football
The formula is straightforward.
PPDA = Opposition passes completed in the pressing zone divided by defensive actions taken by the pressing team in the pressing zone.
Most platforms define the pressing zone as the opponent’s half. Some analysts set the zone boundary at the opposition’s defensive third. The zone you define must remain fixed across all sessions and all analysts on your staff. If one analyst applies a half-pitch boundary and another uses a more advanced line, the resulting numbers cannot be compared between matches and the trend data becomes worthless.
Defensive actions are most commonly defined as tackles, interceptions, and fouls. Some platforms include pressing duels or ball challenges. Before adopting a PPDA benchmark from an external source or a published analysis, confirm which defensive action definition that source is using. Mixing definitions between platforms or analysis sessions is one of the most consistent causes of data integrity failure in pressing analysis at academy and lower-league level.
What Is a Good PPDA Score in Football?
There is no universal benchmark because the reference range shifts with league level, opposition quality, match context, and tactical setup. The following ranges serve as a working guide for professional and semi-professional contexts.
A score below 6.0 is characteristic of elite high-press systems operating over a sustained run of matches. A score between 6.0 and 9.0 represents moderate pressing intensity and is common across mid-table Premier League and Championship clubs. A score above 10.0 indicates a low-block or reactive pressing approach and is typical in lower leagues or in teams with clear squad limitations in the pressing phase.
Match context compounds this further. A side managing a two-goal lead at 75 minutes will produce a higher PPDA than the same side pressing aggressively from the front in the first half hour. Using a single-match PPDA figure as a measure of system quality is a common analytical error. A rolling average across six to ten matches provides a far more stable signal.
The most important risk at academy and lower-league level is benchmarking against elite league PPDA data without adjusting for opposition pass volume. Lower leagues produce fewer completed passes per match. That mechanically inflates PPDA scores even for teams pressing at high intensity. Always establish a league-specific baseline before drawing tactical or recruitment conclusions from PPDA comparisons.
PPDA vs Other Pressing Metrics: Signal vs. Friction
PPDA is not the only pressing metric available. The analytical question is not which metric is most sophisticated. It is which metric delivers the clearest signal for the lowest capture cost at your level and with your available staffing resource.
| Metric | Easy-to-Track Version | High-Value Version | Capture Cost | Verdict |
|---|---|---|---|---|
| PPDA | Passes in opponent half divided by tackles and interceptions | Possession-adjusted PPDA calculated separately by match phase | Low on standard platforms | Keep as primary pressing KPI |
| Press-break rate | Percentage of press sequences where opposition plays forward | Press-break rate by pitch zone with transition outcome recorded | Medium on most platforms | Keep as companion KPI to PPDA |
| Counterpressing recoveries | Ball recoveries within 5 seconds of possession loss | Recovery location with direct shot or chance creation outcome | High across all levels | Add only after PPDA and press-break rate are stable |
| Defensive action rate | Raw tackle and interception total per match | Tackle and interception success rate by press trigger zone | Low but misleading in isolation | Cut: PPDA already contains and normalises this signal |
| Sprint volume in press | Total sprints recorded in the opponent half per match | Sprint timing relative to pass trigger and press structure | Very high below Championship level | Cut: GPS required and adds no pressing quality signal |
Press-break rate is the most important companion metric to PPDA. Where PPDA tells you how frequently the opposition completes passes before your team acts, press-break rate tells you how often the opposition escapes your press entirely and advances into a dangerous zone. A low PPDA paired with a high press-break rate means your team is engaging frequently but the opposition is playing through your structure reliably. That combination should prompt a tactical conversation about press triggers and shape compactness, not a conversation about effort or athletic output.
How to Apply PPDA Football at Academy and Lower-League Level
The primary challenge at academy and lower-league level is not the metric itself. It is the capture cost of tracking PPDA consistently across a full season with limited analyst time and partial video coverage.
Most analysis workflows at this level are built around clip review rather than structured event tagging. Asking a part-time analyst or a coaching volunteer to tag every opposition pass in the opponent’s half alongside every tackle, interception, and foul across 40 or more matches is a substantial annotation burden. When that burden exceeds the time available, tagging accuracy drops, errors accumulate, and the numbers lose the consistency they require to be trustworthy.
The minimum viable annotation approach for PPDA at this level is to define defensive actions as tackles and interceptions only, exclude fouls to eliminate grey-area tagging decisions, and apply a fixed half-pitch zone boundary without exception. That reduces capture friction materially without eliminating the core signal. Once the workflow is stable across a full month of matches and the baseline is established, press-break rate can be introduced as a second tracking layer.
Do not add counterpressing success rate, possession-adjusted PPDA by phase, or high defensive actions per possession chain until both PPDA and press-break rate are reliable, understood by the coaching staff, and referenced regularly in tactical debrief. Introducing complexity before staff adoption is the most consistent reason pressing data programmes fail at non-elite level. The Complexity Wall is not a data problem. It is a workflow problem.
What to Cut from Your Pressing Data Stack
The following metrics appear regularly in pressing dashboards built below professional level. Most should be removed until PPDA and press-break rate are stable and embedded in the coaching workflow. Each one adds capture cost without materially improving the signal available for tactical decision-making.
| Metric | Why Teams Track It | Signal Value | Capture Cost | Decision |
|---|---|---|---|---|
| Raw pressing count | Simple to count and appears to measure effort | Low: does not adjust for opposition possession share | Low | Cut: PPDA provides a normalised version of this signal already |
| Sprint volume in press | Linked to physical output and effort culture | Low for pressing quality: reflects fitness not tactical structure | Very high below Championship level | Cut: use GPS load data in the Performance stack not the Pressing stack |
| Defensive action success rate | Appears to indicate press quality | Medium but unstable in samples under 10 matches | Medium | Cut until minimum 10-match sample is available then review |
| Possession in press trigger zone | Tracks how often teams invite or concede the press | Low as a standalone signal below professional level | High | Cut: not accessible without advanced spatial tracking |
| High defensive actions per possession chain | Popular in advanced analytics dashboards | Medium in professional context only | High at amateur and academy level | Cut: too complex for a minimum viable pressing stack |
The goal is not to track everything available. The goal is a pressing intelligence stack compact enough that your coaching staff opens it before a session and references it during a tactical debrief without requiring an analyst to interpret every figure. That requires fewer metrics tracked reliably, not more metrics tracked inconsistently.
PPDA Football FAQ
What does PPDA stand for in football?
PPDA stands for Passes Per Defensive Action. It measures the average number of passes an opposition completes in a defined pitch zone for every defensive action taken by the pressing team in that same zone.
What is a good PPDA score in football?
A PPDA below 6.0 is associated with elite high-press systems across a sustained match run. A score between 6.0 and 9.0 represents moderate pressing intensity across most professional contexts. Scores above 10.0 typically indicate a low-block or reactive defensive approach.
What is PPDA meaning in football analysis?
In football analysis, PPDA meaning refers to pressing intensity expressed as a single number. A lower score means the pressing team is engaging the opposition more aggressively and allowing fewer passes before making a defensive action. Analysts use it to evaluate pressing system effectiveness across matches and across a season rather than relying on raw defensive action counts.
Is PPDA enough to evaluate pressing quality?
No. PPDA measures pressing intensity but does not measure pressing structure. Two teams can produce identical PPDA values even if one presses as a coordinated defensive block while the other relies on isolated individual pressure.
For that reason, PPDA is best interpreted alongside a second metric such as press-break rate to determine whether the pressing system is actually constraining opposition build-up play.
How is football PPDA different from raw pressing count?
Football PPDA normalises for opposition possession share, which raw pressing count does not. A team making 40 defensive actions against a side completing 240 passes is under very different tactical conditions than a team making 40 defensive actions against a side completing 80 passes. PPDA accounts for that difference. Raw count does not.
What does PPDA mean in football for a head coach?
For a head coach, what PPDA means in football is a compact session-ready signal about whether the pressing system is engaging at the right frequency. Paired with press-break rate, it provides a two-metric baseline for evaluating the defensive press without requiring full tactical video review before every training session.